Normative data can be used to identify whether your results are within a healthy range based on gender and age. You can use the below data to set yourself goals and target ranges that you are training towards.
Muscle mass normative data is rather complex due to many factors both physical and lifestyle oriented that affect the outcome. Therefore we do not prescribe any normative data values due to the vast amount of different variants you have to cover in order to help categorise each individual.
Fat
Body fat ranges for women
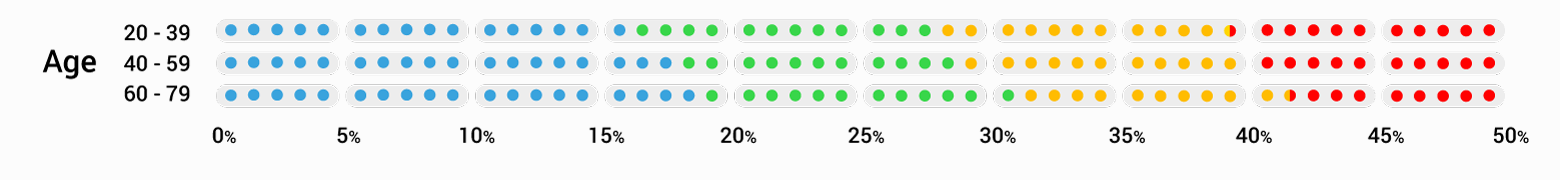
Women ( age ) | Underfat | Healthy | Overfat | Obese |
20 - 39 | 0 - 16% | 17 - 28% | 29 - 39.5% | 39.5 - 50% |
40 - 59 | 0 - 18% | 19 - 29% | 30 - 40% | 41 - 50% |
60 - 79 | 0 - 19% | 20 - 31% | 32 - 41.5% | 41.5 - 50% |
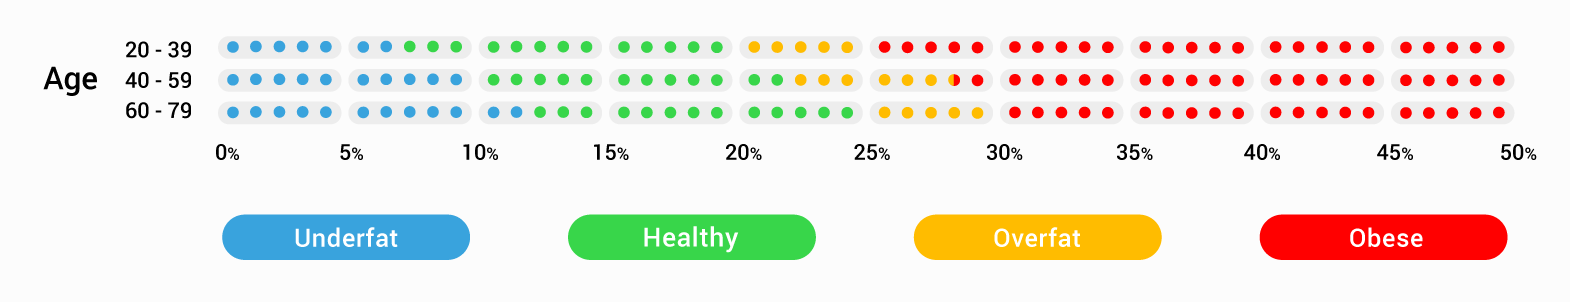
Men ( age ) | Underfat | Healthy | Overfat | Obese |
20 - 39 | 0-7% | 8 - 20% | 21 - 25% | 26 - 50% |
40 - 59 | 0-10% | 11 - 20% | 23 - 28.5% | 28.5 - 50% |
60 - 79 | 0-12% | 13 - 25% | 26 - 30% | 31 - 50% |
BMI
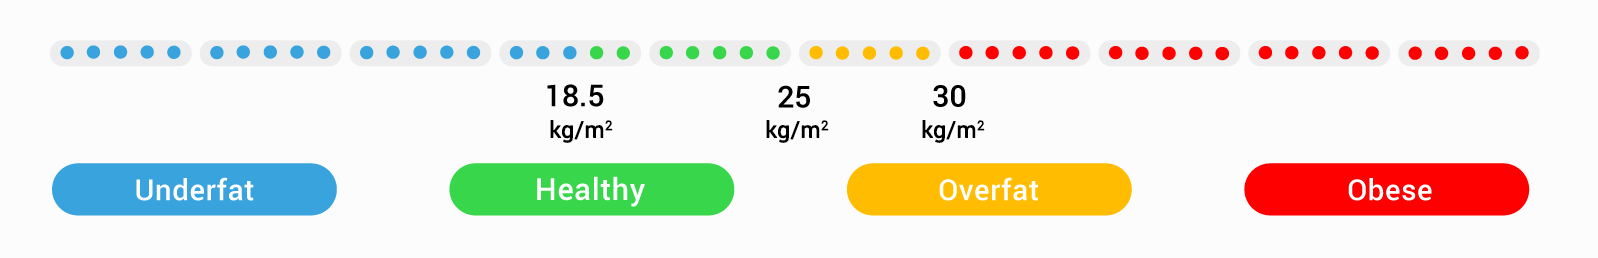
BMI | Underfat | Healthy | Overfat | Obese |
| | <18.5 | 18.5 - 24.9 | 25 - 29.9 | >30 |
Hydration